StatusPulse v3.2 — Now with WebSocket monitoring
Real-Time Uptime Monitoring & Status Pages
Sub-second latency checks across 28 global probes. Know about downtime before your customers do. Built for DevOps teams who refuse to sleep on incident response.

Trusted by engineering teams at
Meridian Cloud
Monitoring 140 endpoints across 6 regions
Trellis Health
99.99% uptime SLA enforcement since 2021
NovaPay
Payment gateway monitoring, zero missed incidents
Arcadia SaaS
Public status page serving 2,400+ visitors/month
Platform Capabilities
Everything You Need to Keep Infrastructure Visible
Three pillars of observability — monitoring, alerting, and communication — unified under one roof with a 5-minute setup.
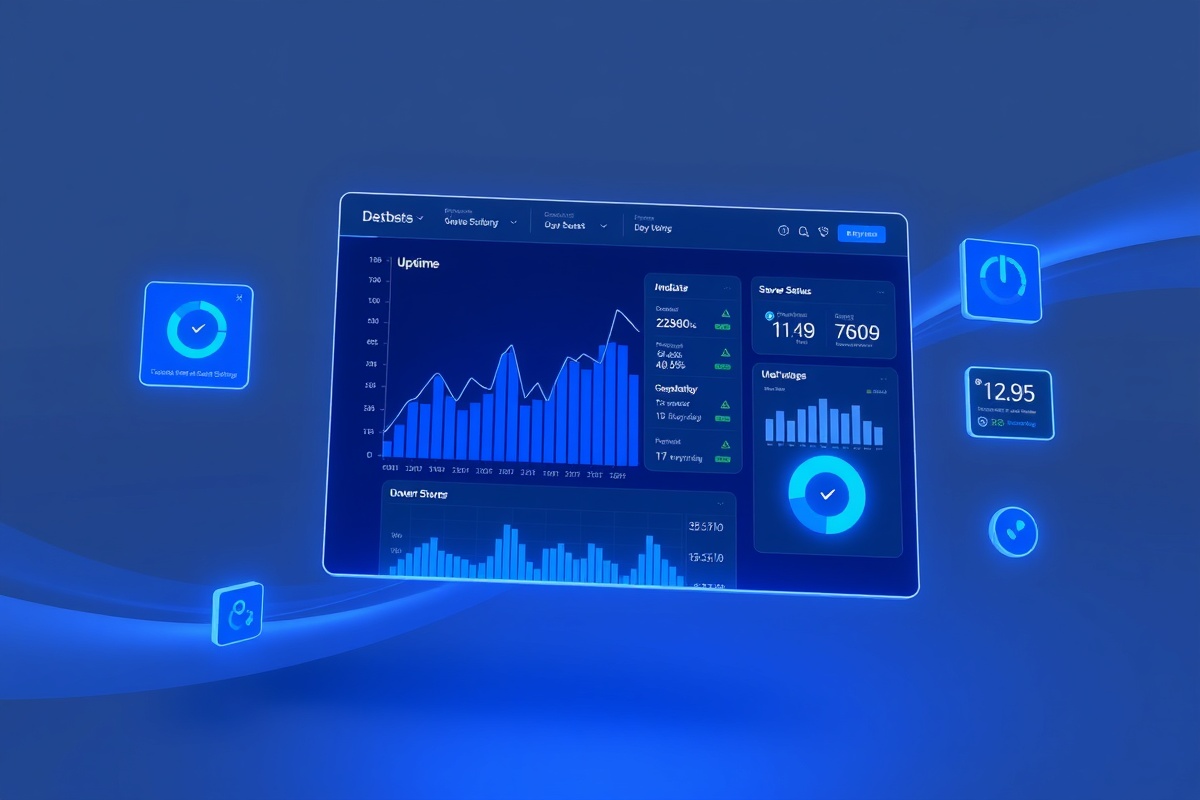
Global Uptime Monitoring
HTTP(S), TCP, DNS, SSL, ICMP, and WebSocket checks dispatched every 30 seconds from probes in 28 cities — including São Paulo, Singapore, Frankfurt, and Ashburn. Sub-second resolution lets you detect degradation before it becomes an outage. SSL certificate expiry tracking alerts you 30, 14, and 3 days before expiration. Historical uptime data retained for 18 months.
Intelligent Alerting
Route incidents to Slack, PagerDuty, Opsgenie, Discord, email, or SMS with zero-code webhooks. Smart deduplication collapses 200 false-positive pings into a single alert. Escalation policies rotate between on-call engineers on a 12-hour schedule. Maintenance windows suppress alerts automatically so your team can deploy without noise. Average time-to-notify: 4 seconds.
Custom Status Pages
White-label status pages at status.yourcompany.com with your branding, logo, and domain. Auto-generated incident timelines keep customers informed without a single tweet. RSS and email subscriptions let users follow specific services. Uptime history charts and MTTR metrics build trust. Over 12,000 public status pages powered by StatusPulse.
How It Works
From Zero to Fully Monitored in Five Minutes
No agents, no infrastructure changes, no learning curve. Point StatusPulse at your endpoints and let the probes do the rest.
1. Add Your Endpoints
Paste your URLs, hostnames, or IP addresses. Choose check type — HTTP, TCP, DNS, SSL, or WebSocket — and set your interval from 30 seconds to 5 minutes. Bulk-import up to 200 endpoints via CSV or API in a single operation.
2. Configure Alert Rules
Define thresholds for response time, HTTP status codes, and SSL validity. Map each endpoint to an alert channel — Slack #ops for warnings, PagerDuty for criticals. Set escalation chains so the right person is paged at the right time, even at 3 a.m.
3. Publish Your Status Page
Connect a custom domain, pick a theme, and go live. StatusPulse auto-populates service groups, uptime percentages, and incident logs. Your customers get transparency; your support tickets drop by an average of 34%.
By the Numbers
Infrastructure That Scales With Yours
2.4M Checks / Day
Processed across 28 global probe locations with a 99.997% platform uptime over the last rolling 365 days.
14,800 Endpoints
Actively monitored for 3,200 teams — from solo founders at YC startups to platform engineering groups at Fortune 500 companies.
4-Second Alert Latency
From the moment a probe detects failure to the moment your on-call engineer receives a PagerDuty notification. No polling loops, no batching delays.
12,000+ Status Pages
Serving an average of 8,400 page views per page per month. Your customers trust what they can see.
Spotlight Feature
Anomaly Detection That Catches Slow Degradation
Most monitors only tell you when something is down. StatusPulse tells you when something is slowing down.
Our baseline-learning engine builds a 14-day rolling profile of normal response times for every endpoint. When latency drifts 2 standard deviations above the mean — even if the HTTP status is still 200 — you get a "Degradation Detected" alert. This caught a database connection pool exhaustion at Meridian Cloud 47 minutes before it would have triggered a full timeout cascade. Their SRE lead, Priya Nakamura, called it "the feature that saved our Black Friday."
What Teams Say
Engineers Trust StatusPulse
Priya Nakamura
Senior SRE, Meridian Cloud
"We migrated from UptimeRobot after StatusPulse caught a DNS TTL misconfiguration that our old tool silently missed for three weeks. The anomaly detection alone is worth the subscription. Our incident response time dropped from 12 minutes to under 90 seconds."
Marcus Ellison
CTO, NovaPay
"Our payment gateway can't afford blind spots. StatusPulse's 30-second check interval from probes in Ashburn, Frankfurt, and Singapore gives us geographic coverage that matches our customer base. The public status page has cut our support queue by a third."
Aisha Okonkwo
Platform Lead, Trellis Health
"We monitor 62 endpoints across our telehealth platform. StatusPulse's maintenance window feature lets us schedule deployments without alert fatigue, and the auto-generated incident timelines keep our patients informed without our team writing a single update."
Frequently Asked Questions
Common Questions
How many endpoints are included in the free plan?
The free tier includes 10 monitored endpoints with 5-minute check intervals, one status page, and email-only alerts. No credit card required. Upgrade anytime to unlock 30-second intervals, custom domains, and multi-channel alerting.
Can I import monitors from UptimeRobot or Pingdom?
Yes. Our one-click importer pulls endpoints, alert contacts, and uptime history from UptimeRobot, Pingdom, and Better Stack. Historical data is preserved for up to 90 days during migration.
Where are your monitoring probes located?
28 locations across North America (Ashburn, Dallas, Montreal, Los Angeles), Europe (Frankfurt, London, Amsterdam, Warsaw, Paris), Asia-Pacific (Singapore, Tokyo, Sydney, Mumbai, Seoul), South America (São Paulo, Santiago), and Africa (Cape Town, Lagos). New probes are added quarterly.
Is there an API for programmatic access?
A full REST API with OAuth 2.0 authentication lets you create monitors, pull uptime data, create incidents, and manage status pages programmatically. Terraform and Pulumi providers are community-maintained and available on GitHub.
What happens during a StatusPulse platform outage?
Our platform has maintained 99.997% uptime over the last 365 days. Probes are geographically distributed — if one region goes dark, checks continue from the remaining 27. We also publish our own status page at status.statuspulse.io, monitored by a third-party provider.
Do you offer SOC 2 or compliance reports?
StatusPulse is SOC 2 Type II certified. Audit reports are available to enterprise customers under NDA. We also support SSO via SAML 2.0, field-level encryption for sensitive endpoint data, and EU data residency for teams requiring GDPR-aligned infrastructure.
Stop Guessing. Start Monitoring.
Join 3,200 engineering teams who catch incidents in seconds — not hours. Free for up to 10 endpoints. No credit card. No setup wait.